Loading...
e-VSM • Value Stream Mapping Software
Turn Your Value Stream Map
Into a Live Improvement Model
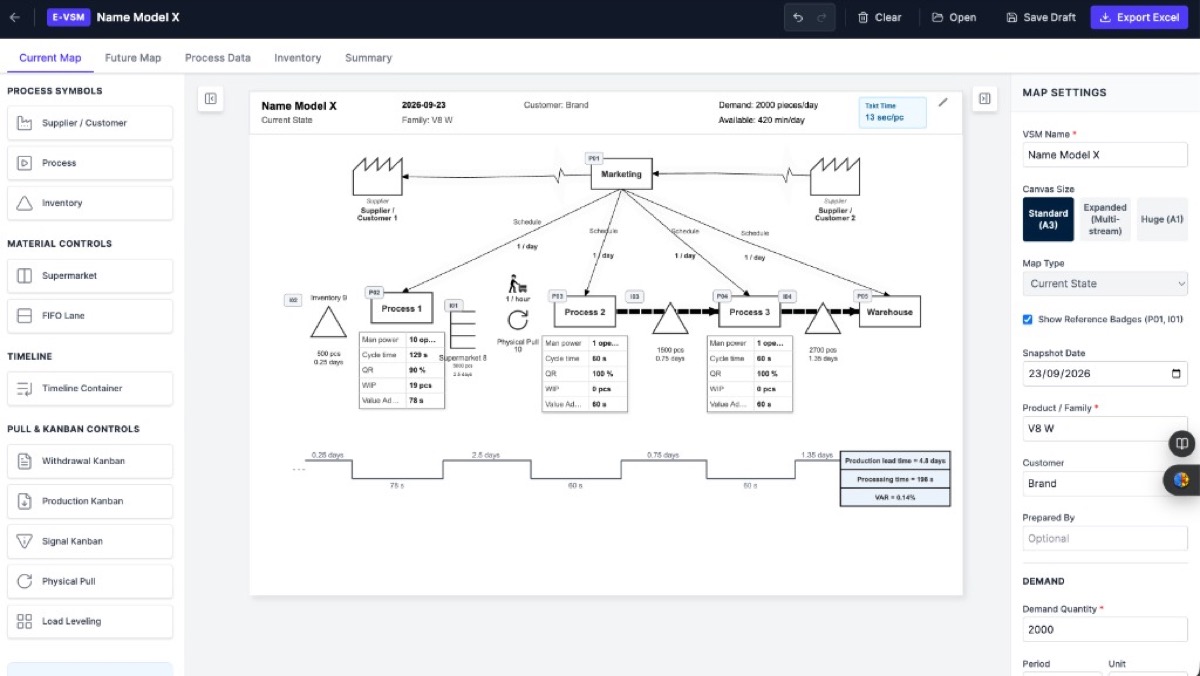
Build your Current State. Automatically calculate the value stream.
Design your Future State. See the improvement before you change the floor.
e-VSM connects your process map, operational data, Lean calculations,
and future-state analysis in one live model.
No more drawing → Excel → recalculating → redrawing.
Your VSM Should Do More Than Look Good on the Wall
Traditional VSM often becomes a cycle:
Draw → Measure → Excel → Analyze → Redraw → Present → Update again
Every change means more manual work.
e-VSM keeps everything connected.
Map your process ↓ Measure automatically ↓ Identify waste and opportunities ↓ Design your Future State ↓ Compare the improvement
One map. One dataset. One calculation.
From Current State to Future State
See the impact of improvement — before implementation
Start with your actual Current State. Enter your process and inventory data. e-VSM automatically calculates the key value-stream metrics.
Then design your Future State and see how the changes affect the overall value stream.
CURRENT STATE
Lead Time12.4 days
Value-Added42 min
NVA Time12.3 days
PCE0.24%
→
FUTURE STATE
Lead Time7.8 days
Value-Added42 min
NVA Time7.7 days
PCE0.40%
See the improvement
−4.6 days Lead Time
−37% NVA Time
+67% PCE
Example values shown for illustration. Actual results are calculated from your process data.
01
Build Your Current State
Map the process you actually have. Create your Current State VSM digitally without rebuilding diagrams every time your data changes. Add your process data directly to the map.
02
Measure Automatically
Let the map calculate the numbers. Stop maintaining a separate VSM and Excel calculation. e-VSM automatically calculates value-added time, lead time, process time, and inventory.
03
Analyze the Waste
Find where your time is really going. e-VSM helps you see where the value stream is consuming time and where improvement opportunities exist.
04
Design Your Future State
Don't just draw a better process. Model it. Create your Future State from your Current State. Test changes to the flow and see how they affect metrics.
05
Compare the Improvement
Turn your VSM into an improvement story. Compare the results clearly. From a complicated process map to a clear improvement story.
More Than a VSM Drawing
An Extended VSM for Continuous Improvement
e-VSM brings the map and its analysis together. Your VSM becomes a working improvement model — not just a picture.
- Visualize: Build a complete value-stream map.
- Calculate: Automatically calculate your value-stream metrics.
- Analyze: Identify lead-time, inventory and process opportunities.
- Improve: Design and evaluate your Future State.
- Compare: Show the difference between Current and Future State.
- Report: Export your work for communication and implementation.
Built for Lean Practitioners
Designed around the way improvement actually happens
- Lean ManagersBuild and maintain Current and Future State maps without managing separate calculations.
- Continuous Improvement EngineersAnalyze process data and quantify improvement opportunities.
- Production & Operations ManagersSee where lead time, waiting and inventory are accumulating.
- Lean ConsultantsCreate consistent VSMs and communicate improvement opportunities clearly.
- Manufacturing TeamsKeep the value-stream analysis connected to the process instead of leaving it on a wall.
From VSM Workshop to Management Report
Keep the work after the workshop
Your VSM doesn't have to end when the workshop ends. Use e-VSM to:
Map → Analyze → Improve → Compare → Report
Export your work when you're ready to communicate the results or continue your improvement project.
See an Example VSMWhy e-VSM?
Because your value stream is not a picture.
Traditional VSM:
Paper → Excel → Diagram → Manual calculation → Presentation → Update
e-VSM (One live model):
Process data ↓ VSM ↓ Automatic calculations ↓ Current State ↓ Future State ↓ Improvement
"One source of truth for your value-stream analysis."
Start With One Process
See what e-VSM can do with your real process
You don't need to transform your entire factory on day one. Take one value stream. Build the Current State. Enter your real process data. Then see what happens when you design the Future State.
Start mapping for free
Upgrade when you need Future State, deeper analysis and professional reporting.
Free
Start mapping for free
Build and explore your Current State without committing to a subscription.
$0 / Forever
- ✓ Current State mapping
- ✓ Automatic basic calculations
- ✓ Save progress to your local storage
Recommended
Pro
For individual Lean practitioners
Build Current and Future State maps and turn your VSM into a practical improvement workspace.
$149.99 / year
or $14.99 / mo
- + Everything in Free
- + Future State mapping
- + Process & inventory analysis
- + Summary / Current vs Future
- + PDF & Excel reporting
- + More project storage
Team
For Lean & CI teams
Use e-VSM across multiple improvement projects and teams.
$599.99 / year
or $59.99 / mo (max 3 users)
- ✓ Everything in Pro
- ✓ Access to 3 flow apps (e-VSM, Yamazumi, and layout creator)
- ✓ Central billing
- ✓ Priority support
Enterprise
For organizations standardizing improvement
Organization-wide deployment, licensing, onboarding and tailored requirements.
Custom
- ✓ Everything in Team
- ✓ Single Sign-On (SSO)
- ✓ Custom integrations
Frequently Asked Questions
No. e-VSM combines the VSM map with process data, calculations, analysis and Future State design.
Yes. e-VSM is designed around the Current State → Analysis → Future State workflow.
Yes. Supported value-stream metrics are calculated from the data entered into your map.
Yes. e-VSM supports PDF and Excel export.
e-VSM is designed for Lean practitioners, but the workflow is structured to guide you from Current State through Future State.
Yes. e-VSM is designed around real-world manufacturing and Lean improvement workflows.
Your Value Stream Is Already Changing.
Make your VSM keep up.
Build the Current State. Calculate the reality. Design the Future State. See the improvement.
Start building your first e-VSM.